16 💻 Second Intermediate Sample Questions
Hi guys, these are the sample questions that prof Dabo gave us to exercise yourself. As you may notice most of them are open questions on very superifical theory concepts, no indeep math or heavy calculations (matrix products, dot products etc.). So please my suggestion is to review carefully the slides and just learn the basic R commands to execute analysis on a higer level! 🍀
16.1 👨🎓 2023/2024 (2nd intermediate)
16.1.1 Exercise 10.1 Basic Understanding:
What does PCA stand for?
Briefly explain the primary objective of Principal Component Analysis.
How does PCA help in dimensionality reduction?
16.1.2 Exercise 10.2 Library and Data Loading:
Which R library is commonly used for performing PCA?
Write the command to load the library FactomineR for PCA.
How do you read a dataset into R for PCA analysis?
16.1.3 Exercise 10.3 Data Preparation:
Explain the importance of scaling or standardizing variables before applying PCA.
Write the R command to standardize a data matrix.
16.1.4 Exercise 10.4 PCA Execution:
What function in R is used to perform PCA?
Provide the basic syntax for running PCA on a dataset named « my_data.»
16.1.5 Exercise 10.5 Interpretation of Results:
How can you access the proportion of variance explained by each principal component in the following R script?
What is the significance of the eigenvalues and eigenvectors in PCA?
16.1.6 Exercise 10.6 Selecting Principal Components:
How can you determine the optimal number of principal components to retain in R?
Write the R command to extract the loadings of principal components.
16.1.7 Exercise 10.7 The inertia of a centered matrix of n individuals and p quantitative variables is
- p
- The sum of variances of the p variables
- None of the responses are true
16.1.10 Exercise 10.10 Let Z be a matrix (50 rows and 4 columns) of centered and reduced quantitative data, with a correlation matrix R (of dimension 4) and three eigenvalues are 2, 1 and 0.4.
Give the maximum number of eigen-values
Give the remaining eigen-values
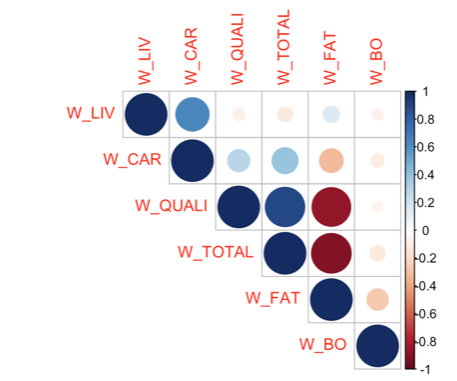
16.1.11 Exercise 10.11 A dataset X gives, for 23 Charolais and Zebus cattles, 6 different weights, in kg: live weight (W_LIV), carcass weight (W_CAR), prime meat weight (W_QUALI), total meat weight (W_TOTAL), fat meat weight (W_FAT), bone weight (W_BO) and the cattle type (Type).
How do you interpret the following correlation matrix plot?
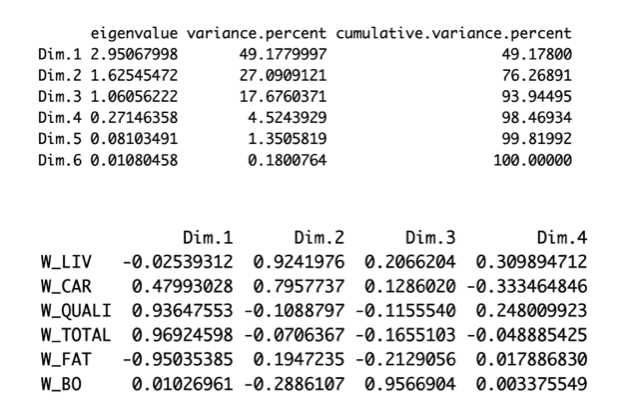
How many components would you choose regarding the following figures (giving the eigen-values and correlation between the components and the variables)
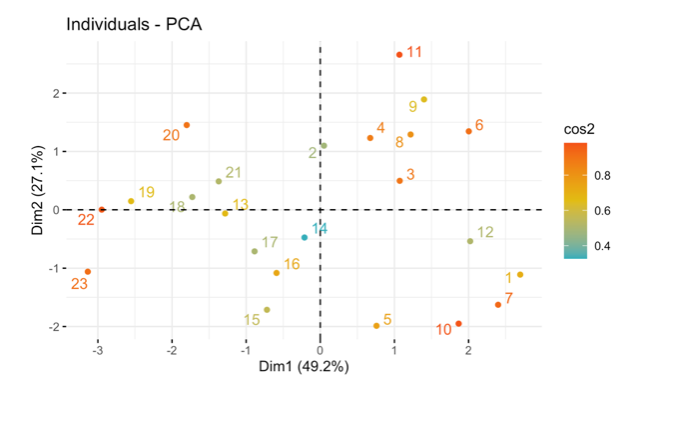
Interpret the following figure:
16.1.12 Exercise 10.12 Scree Plot:
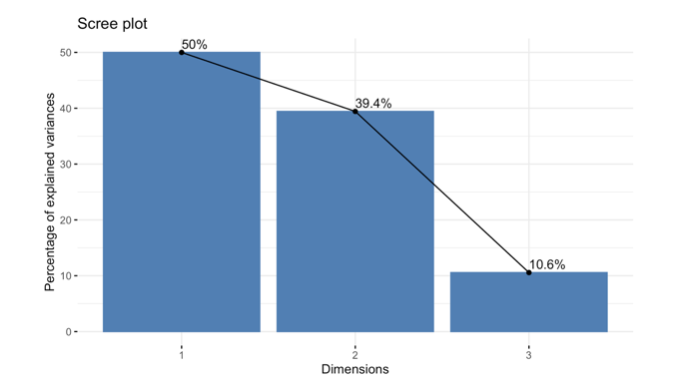
What is the purpose of a scree plot in PCA?
How do you generate and interpret the following scree plot ?
16.1.13 Exercise 10.13 Scree Plot:
Briefly explain the main objective of Correspondence Analysis (CA).
How is CA different from Principal Component Analysis (PCA)?
Provide an example of a scenario where CA would be a suitable analysis.
16.1.14 Exercise 10.14 Correspondence Analysis:
Briefly explain the main objective of Correspondence Analysis (CA).
How is CA different from Principal Component Analysis (PCA)?
Provide an example of a scenario where CA would be a suitable analysis.
16.1.15 Exercise 10.14 CA Execution:
Provide the basic syntax for running CA on a contingency table named “my_table.”
16.1.16 Exercise 10.14 Interpretation of Results:
How can you access the row and column scores of the CA results in R?
16.1.17 Exercise 10.15 Visualization:
Write the R command to create a biplot for a Correspondence Analysis result.
How can you visually assess the relationships between rows and columns in a CA plot?
16.1.18 Exercise 10.16 E3:
Write the R command to extract the contributions of dimensions in CA (write it in general)
16.1.20 Exercise 10.18 Chi-Square Test:
What is the role of the chi-square test in Correspondence Analysis?
How can you perform a chi-square test on a CA result in R?
16.1.22 Exercise 10.20 K-Means Clustering:
What is the fundamental concept behind K-means clustering?
Explain the meaning of centroids in the context of K-means clustering.
Write the R command to perform K-means clustering on a dataset named “my_data.”
16.1.23 Exercise 10.21 Hierarchical Clustering:
Briefly explain how hierarchical clustering works.
Write the R command to conduct hierarchical clustering on a dataset.
16.1.24 Exercise 10.22 Interpretation of Clustering Results:
How do you interpret the following output of a clustering analysis on the cattle data?
16.1.25 Exercise 10.23 Classification:
What is the main goal of a classification ?
Provide an example of a real-world application where classification analysis could be beneficial.
How can classification be used in medical diagnosis or fraud detection?
16.1.26 Exercise 10.24 What does PCA stand for?
- Primary Component Analysis
- Principal Component Algorithm
- Principal Component Analysis
- Primary Component Algorithm
16.1.27 Exercise 10.25 In PCA, what is the primary goal?
- Reduce dimensionality while preserving variance
- Increase dimensionality for better visualization
- Minimize all components equally
- Focus on individual components only
16.1.28 Exercise 10.26 Which R function is commonly used to perform PCA?
- kmeans()
- PCA()
- prcomp()
- corresp()
16.1.29 Exercise 10.27 What is the purpose of a scree plot in PCA?
- Visualize the clusters in data
- Assess the quality of clustering
- Evaluate the distribution of data
- Display the eigenvalues of principal components
16.1.30 Exercise 10.28 How do you determine the optimal number of principal components to retain in PCA?
- Use hierarchical clustering
- Examine the scree plot
- Apply k-means clustering
- Perform a chi-square test
16.1.31 Exercise 10.29 What is the primary application of Correspondence Analysis (CA)?
- Reducing dimensionality of numerical data
- Analyzing relationships in categorical data
- Classifying data points into clusters
- Predicting future values in a time series
16.1.32 Exercise 10.30 Which R library is commonly used for Correspondence Analysis?
- cluster
- caret
- ca
- factoextra
- FactomineR
16.1.33 Exercise 10.31 What is the role of the chi-square test in Correspondence Analysis?
- Assess the significance of relationships
- Determine the optimal number of clusters
- Evaluate the distribution of data
- Visualize the proximity between data points
16.1.34 Exercise 10.32 What is the primary goal of clustering algorithms?
- Dimensionality reduction
- Classification
- Grouping similar data points
- Visualization of data
16.1.35 Exercise 10.33 Which R function is commonly used for K-means clustering?
- hierarch()
- PCA()
- kmeans()
- prcomp()
16.1.36 Exercise 10.34 How can you visually assess relationships between rows and columns in a clustering plot?
- Scree plot
- Dendrogram
- Silhouette plot
- Biplot
16.1.37 Exercise 10.35 What is the primary goal of a classification algorithm?
- Group similar data points
- Predict numerical values
- Assign labels to data points
- Visualize high-dimensional data
16.1.38 Exercise 10.36 Which algorithm is commonly used for binary classification tasks? (Answers can be more than one)
- Decision Trees
- K-means
- LDA
- Logistic Regression
16.1.39 Exercise 10.37 Which metric is commonly used to evaluate the performance of a classification model?
- R-squared
- Mean Absolute Error
- Silhouette Score
- Accuracy
16.1.40 Exercise 10.38 PCA Eigenvalues:
In PCA, what does a high eigenvalue indicate?
- The principal component explains a large amount of variance
- The principal component is not important
- The data has high correlation
- None of the above
16.1.41 Exercise 10.39 PCA Loadings:
What do loadings represent in PCA?
- The correlation between variables and principal components
- The eigenvalues of the components
- The proportion of variance explained
- The number of observations
16.1.42 Exercise 10.40 K-Means Initialization:
Why is it important to set a seed when performing K-means clustering?
- To ensure reproducibility of results
- To increase the number of clusters
- To improve the accuracy
- To reduce computation time
16.1.43 Exercise 10.41 Hierarchical Clustering Methods:
Which of the following are common linkage methods in hierarchical clustering?
- Complete linkage
- Single linkage
- Average linkage
- All of the above
16.1.44 Exercise 10.42 Optimal Number of Clusters:
How can you determine the optimal number of clusters in K-means?
- Using the elbow method
- Using silhouette analysis
- Using within-cluster sum of squares
- All of the above
16.1.45 Exercise 10.43 CA vs PCA:
What type of data is Correspondence Analysis designed for?
- Continuous numerical data
- Categorical data in contingency tables
- Time series data
- Binary data only
16.1.46 Exercise 10.44 PCA Scaling:
What happens if you don’t scale variables before PCA?
- Variables with larger scales will dominate
- The results will be incorrect
- PCA cannot be performed
- Nothing, scaling is optional
16.1.47 Exercise 10.45 Clustering Distance:
What is the most common distance metric used in clustering?
- Euclidean distance
- Manhattan distance
- Correlation distance
- All of the above
16.1.48 Exercise 10.46 Classification vs Clustering:
What is the main difference between classification and clustering?
- Classification requires labeled data, clustering does not
- Clustering requires labeled data, classification does not
- They are the same thing
- Classification is supervised, clustering is unsupervised
16.1.49 Exercise 10.47 PCA Visualization:
What is a biplot used for in PCA?
- To visualize both variables and observations
- To show only eigenvalues
- To display correlation matrices
- To plot residuals
16.1.50 Exercise 10.48 CA Interpretation:
In Correspondence Analysis, what does proximity between row and column points indicate?
- Strong association between categories
- Weak association
- No relationship
- Random distribution
16.2 Solutions
16.2.1 Answer to Question 10.1:
What does PCA stand for? Principal Component Analysis
Briefly explain the primary objective of Principal Component Analysis. PCA aims to reduce the dimensionality of a dataset while preserving as much variance as possible. It transforms the original variables into a smaller set of uncorrelated variables called principal components.
How does PCA help in dimensionality reduction? PCA identifies directions (principal components) in which the data varies the most. By keeping only the first few principal components that explain most of the variance, we can reduce the number of dimensions while retaining most of the information.
16.2.2 Answer to Question 10.2:
Which R library is commonly used for performing PCA? FactoMineR, factoextra, or base R (prcomp, princomp)
Write the command to load the library FactomineR for PCA.
How do you read a dataset into R for PCA analysis?
# For CSV files
my_data <- read.csv("filename.csv")

# For other formats
my_data <- read.table("filename.txt")
16.2.3 Answer to Question 10.3:
Explain the importance of scaling or standardizing variables before applying PCA. Scaling is crucial because PCA is sensitive to the scale of variables. Variables with larger scales will dominate the analysis. Standardizing ensures all variables contribute equally to the principal components.
Write the R command to standardize a data matrix.
16.2.4 Answer to Question 10.4:
What function in R is used to perform PCA?
prcomp(), PCA() (from FactoMineR), or princomp()
Provide the basic syntax for running PCA on a dataset named “my_data.”
16.2.5 Answer to Question 10.5:
How can you access the proportion of variance explained by each principal component?
# Using prcomp
summary(pca_result)$importance[2, ]  # Proportion of variance

# Or calculate manually
eigenvalues <- pca_result$sdev^2
proportion_variance <- eigenvalues / sum(eigenvalues)
What is the significance of the eigenvalues and eigenvectors in PCA? - Eigenvalues: Represent the amount of variance explained by each principal component. Larger eigenvalues indicate components that capture more variance. - Eigenvectors: Represent the direction of each principal component. They show how the original variables contribute to each component (loadings).
16.2.6 Answer to Question 10.6:
How can you determine the optimal number of principal components to retain? - Examine the scree plot (look for the “elbow”) - Use Kaiser’s criterion (keep components with eigenvalues > 1) - Retain components that explain a cumulative variance above a threshold (e.g., 80-90%) - Use parallel analysis
Write the R command to extract the loadings of principal components.
# Using prcomp
loadings <- pca_result$rotation

# Or
loadings <- pca_result$rotation[, 1:k]  # For first k components
16.2.7 Answer to Question 10.1:
What does PCA stand for? Principal Component Analysis
Briefly explain the primary objective of Principal Component Analysis. PCA aims to reduce the dimensionality of a dataset while preserving as much variance as possible. It transforms the original variables into a smaller set of uncorrelated variables called principal components.
How does PCA help in dimensionality reduction? PCA identifies directions (principal components) in which the data varies the most. By keeping only the first few principal components that explain most of the variance, we can reduce the number of dimensions while retaining most of the information.
16.2.8 Answer to Question 10.2:
Which R library is commonly used for performing PCA? FactoMineR, factoextra, or base R (prcomp, princomp)
Write the command to load the library FactomineR for PCA.
How do you read a dataset into R for PCA analysis?
# For CSV files
my_data <- read.csv("filename.csv")

# For other formats
my_data <- read.table("filename.txt")
16.2.9 Answer to Question 10.3:
Explain the importance of scaling or standardizing variables before applying PCA. Scaling is crucial because PCA is sensitive to the scale of variables. Variables with larger scales will dominate the analysis. Standardizing ensures all variables contribute equally to the principal components.
Write the R command to standardize a data matrix.
16.2.10 Answer to Question 10.4:
What function in R is used to perform PCA?
prcomp(), PCA() (from FactoMineR), or princomp()
Provide the basic syntax for running PCA on a dataset named “my_data.”
16.2.11 Answer to Question 10.5:
How can you access the proportion of variance explained by each principal component?
# Using prcomp
summary(pca_result)$importance[2, ]  # Proportion of variance

# Or calculate manually
eigenvalues <- pca_result$sdev^2
proportion_variance <- eigenvalues / sum(eigenvalues)
What is the significance of the eigenvalues and eigenvectors in PCA? - Eigenvalues: Represent the amount of variance explained by each principal component. Larger eigenvalues indicate components that capture more variance. - Eigenvectors: Represent the direction of each principal component. They show how the original variables contribute to each component (loadings).
16.2.12 Answer to Question 10.6:
How can you determine the optimal number of principal components to retain? - Examine the scree plot (look for the “elbow”) - Use Kaiser’s criterion (keep components with eigenvalues > 1) - Retain components that explain a cumulative variance above a threshold (e.g., 80-90%) - Use parallel analysis
Write the R command to extract the loadings of principal components.
# Using prcomp
loadings <- pca_result$rotation

# Or
loadings <- pca_result$rotation[, 1:k]  # For first k components
16.2.13 Answer to Question 10.7:
- p
- The sum of variances of the p variables
- None of the responses are true
16.2.16 Answer to Question 10.10:
Maximum number of eigenvalues: 4 (equal to the number of variables/columns)
Remaining eigenvalue: 0.6 (since eigenvalues sum to p = 4: 2 + 1 + 0.4 + x = 4, so x = 0.6)
16.2.17 Answer to Question 10.24:
- Primary Component Analysis
- Principal Component Algorithm
- Principal Component Analysis
- Primary Component Algorithm
16.2.18 Answer to Question 10.25:
- Reduce dimensionality while preserving variance
- Increase dimensionality for better visualization
- Minimize all components equally
- Focus on individual components only
16.2.20 Answer to Question 10.27:
- Visualize the clusters in data
- Assess the quality of clustering
- Evaluate the distribution of data
- Display the eigenvalues of principal components
16.2.21 Answer to Question 10.28:
- Use hierarchical clustering
- Examine the scree plot
- Apply k-means clustering
- Perform a chi-square test
16.2.22 Answer to Question 10.29:
- Reducing dimensionality of numerical data
- Analyzing relationships in categorical data
- Classifying data points into clusters
- Predicting future values in a time series
16.2.24 Answer to Question 10.31:
- Assess the significance of relationships
- Determine the optimal number of clusters
- Evaluate the distribution of data
- Visualize the proximity between data points
16.2.25 Answer to Question 10.32:
- Dimensionality reduction
- Classification
- Grouping similar data points
- Visualization of data
16.2.28 Answer to Question 10.35:
- Group similar data points
- Predict numerical values
- Assign labels to data points
- Visualize high-dimensional data
16.2.31 Answer to Question 10.38:
- The principal component explains a large amount of variance
- The principal component is not important
- The data has high correlation
- None of the above
16.2.32 Answer to Question 10.39:
- The correlation between variables and principal components
- The eigenvalues of the components
- The proportion of variance explained
- The number of observations
16.2.33 Answer to Question 10.40:
- To ensure reproducibility of results
- To increase the number of clusters
- To improve the accuracy
- To reduce computation time
16.2.35 Answer to Question 10.42:
- Using the elbow method
- Using silhouette analysis
- Using within-cluster sum of squares
- All of the above
16.2.36 Answer to Question 10.43:
- Continuous numerical data
- Categorical data in contingency tables
- Time series data
- Binary data only
16.2.37 Answer to Question 10.44:
- Variables with larger scales will dominate
- The results will be incorrect
- PCA cannot be performed
- Nothing, scaling is optional
16.2.38 Answer to Question 10.45:
- Euclidean distance
- Manhattan distance
- Correlation distance
- All of the above
16.2.39 Answer to Question 10.46:
- Classification requires labeled data, clustering does not
- Clustering requires labeled data, classification does not
- They are the same thing
- Classification is supervised, clustering is unsupervised
16.2.40 Answer to Question 10.47:
- To visualize both variables and observations
- To show only eigenvalues
- To display correlation matrices
- To plot residuals
16.2.41 Answer to Question 10.48:
- Strong association between categories
- Weak association
- No relationship
- Random distribution